Membrane under a gaussian-distributed load
Here we use pyiron as the workflow manager, and FEniCS as a finite-element solver to solve Poisson equation for the defelection of the membrane.
First, we define the problem for a single load on a circular membrane with a radius of 1.
Second, we change the width the load, here defined as
beta, and finally plot the load for each case.
from pyiron_base import Project
import pyiron_continuum
import numpy as np
import matplotlib.pyplot as plt
1. Defining a pyiron project
At first, we define one single job which simulate one single gaussian load and calculate the defelection
pr = Project('membrane')
pr.remove_jobs_silently(recursive=True)
job = pr.create.job.Fenics('mem_default')
job.input
InputList({'mesh_resolution': 2, 'element_type': 'P', 'element_order': 1, 'n_steps': 1, 'n_print': 1, 'dt': 1, 'solver_parameters': {}})
2. Defining a circular domain
job.domain = job.create.domain.circle((0, 0), 1)
help(job.create.domain.circle)
Help on method circle in module pyiron_contrib.continuum.fenics.factory:

circle(center, radius) method of pyiron_contrib.continuum.fenics.factory.DomainFactory instance
3. Generating the mesh
job.input.mesh_resolution = 64
job.input.element_type = 'P'
job.input.element_order = 2
Visualizing the mesh
job.mesh
4. Defining the boundary condition
Here it is assumed that the boundary of the membrane is fixed and therefore the deflection is zero at the boundary
job.BC = job.create.bc.dirichlet(job.Constant(0))
5. Defining the gaussian load
The gaussian expression is defined with parameter beta and R0, where beta specifies the width of the gaussian expression. One can change this width using p.beta =<new value>
beta = 8
R0 = 0.6
p = job.Expression(
    '4*exp(-pow(beta, 2)*(pow(x[0], 2) + pow(x[1] - R0, 2)))',
    degree=1, beta=beta, R0=R0
)
6. Defining the variational formulation of Poisson equation
Here u represents the deflection and v is the test function.
job.LHS = job.dot(job.grad_u, job.grad_v) * job.dx
job.RHS = p * job.v * job.dx
7. Running the job
job.run()
The job mem_default was saved and received the ID: 177
type(job.u)
dolfin.function.function.Function
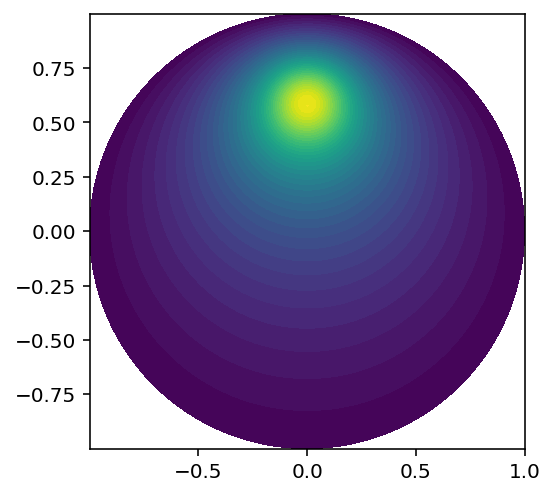
8. Visualizing the deflection
job.plot.solution()
Defining multiple jobs
Here we define multiple job for various beta, and solve Poisson equation for each loading.
betas=[5,6,8,10]
tol = 0.001
y = np.linspace(-1 + tol, 1 - tol, 101)
points = [(0, y_) for y_ in y]
w_line = []
p_line = []
for beta in betas:
    p.beta = beta;
    job_name="mem_{}".format(beta)
    pr.remove_job(job_name)

    job_beta = pr.create.job.Fenics("mem_{}".format(beta))
    job_beta.input.mesh_resolution = 64
    job_beta.input.element_type = 'P'
    job_beta.input.element_order = 2
    job_beta.domain = job.create.domain.circle((0, 0), 1)
    job_beta.BC = job_beta.create.bc.dirichlet(job_beta.Constant(0))

    job_beta.LHS = job_beta.dot(job_beta.grad_u, job_beta.grad_v) * job_beta.dx
    p.beta = beta
    job_beta.RHS = p * job_beta.v * job_beta.dx

    job_beta.run()

    w_line.append(np.array([job_beta.solution(point) for point in points]))
    p_line.append(np.array([p(point) for point in points]))
2020-12-23 16:45:30,171 - pyiron_log - WARNING - Job 'mem_5' does not exist and cannot be loaded
2020-12-23 16:45:30,175 - pyiron_log - WARNING - Job 'mem_5' does not exist and could not be removed
The job mem_5 was saved and received the ID: 178
2020-12-23 16:45:31,477 - pyiron_log - WARNING - Job 'mem_6' does not exist and cannot be loaded
2020-12-23 16:45:31,478 - pyiron_log - WARNING - Job 'mem_6' does not exist and could not be removed
The job mem_6 was saved and received the ID: 179
2020-12-23 16:45:32,747 - pyiron_log - WARNING - Job 'mem_8' does not exist and cannot be loaded
2020-12-23 16:45:32,749 - pyiron_log - WARNING - Job 'mem_8' does not exist and could not be removed
The job mem_8 was saved and received the ID: 180
2020-12-23 16:45:34,091 - pyiron_log - WARNING - Job 'mem_10' does not exist and cannot be loaded
2020-12-23 16:45:34,092 - pyiron_log - WARNING - Job 'mem_10' does not exist and could not be removed
The job mem_10 was saved and received the ID: 181
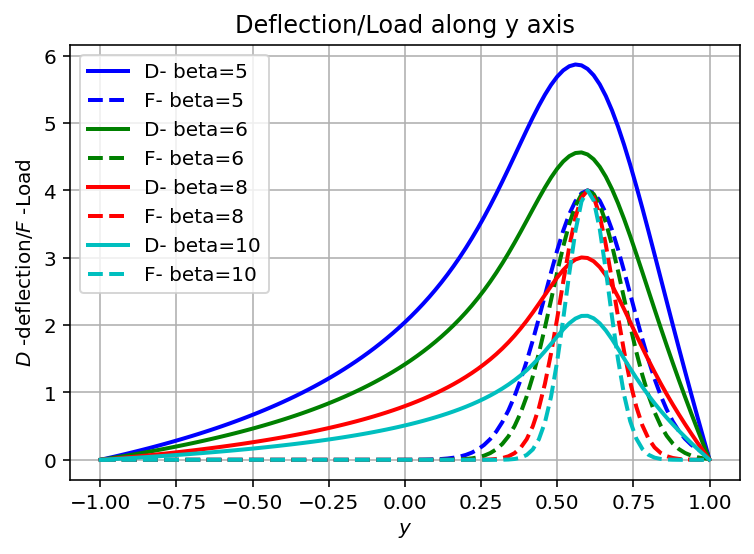
Visualization of the loads and defelections
colors=['b', 'g','r', 'c','k']
%matplotlib inline
for color, beta, deflection, pline in zip(colors,betas,w_line, p_line):
    plt.plot(y, 50*deflection, color, linewidth=2, label = 'D- beta={}'.format(beta))  # magnify w
    plt.plot(y, pline,  color+'--', linewidth=2, label = 'F- beta={}'.format(beta))

plt.grid(True)
plt.xlabel('$y$')
plt.ylabel('$D$ -deflection/$F$ -Load')
plt.legend( loc='upper left')
plt.title("Deflection/Load along y axis")
Text(0.5, 1.0, 'Deflection/Load along y axis')